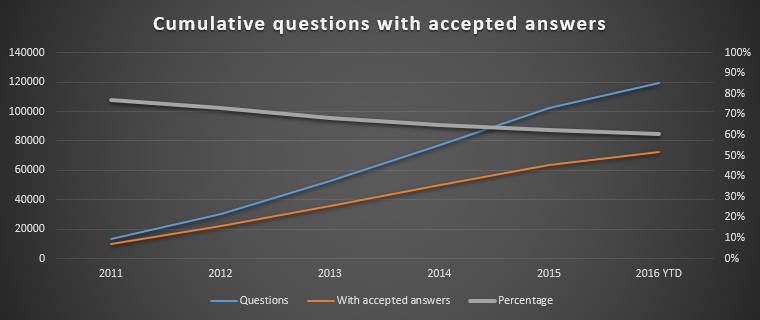
Here is a timeline of how things changed on this site since 2011 (I used a year-specific extraction of a data query). More specifically, it shows the cumulative questions and accepted answers as well as this ratio (or percentage) as the site grows:

                    With accepted
         Questions     answers     Percentage  Growth
2011        13108       10095        77.01
2012        30159       22006        72.97      -5.26
2013        52625       35886        68.19      -6.54
2014        77097       50031        64.89      -4.84
2015       102148       63772        62.43      -3.79
2016 YTD   119297       72239        60.55      -3.01
It is more likely that older questions will have accepted answers as they've been around longer (and there's no limit on when one can accept an answer), hence taking a cumulative view on the site over time.
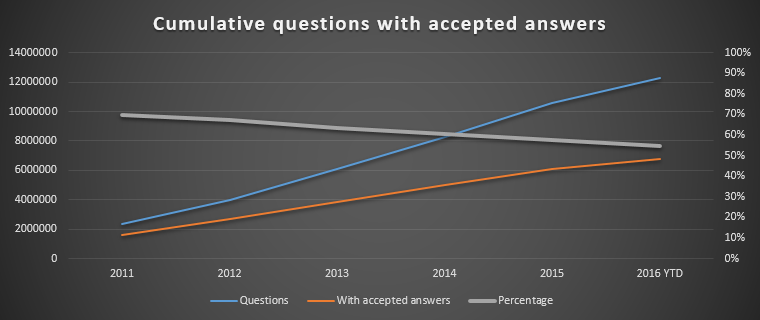
There is a decline in the accept percentage, but other sites show similar declines. Here is Stack Overflow:

                    With accepted
         Questions     answers     Percentage  Growth
2011       2319972     1617512       69.72
2012       3983113     2678124       67.24      -3.56
2013       6057454     3843306       63.45      -5.64
2014       8234853     4985830       60.55      -4.57
2015      10563270     6067815       57.44      -5.12
2016 YTD  12311318     6745451       54.79      -4.62
I think it's reasonable to assume that one may lose answer acceptance over time, with the decline of year-over-year acceptance slowing (perhaps plateauing) as the site grows. This may be as a result of site dilution (through increased scope) and an increased user base (which results in more questions but not necessarily more answers being accepted), amongst other things.
Related queries on Data.SE:


